AirBnb Price Analysis and Prediction
The dataset contains data from the Airbnb website for different listings for
the Los Angeles Area. It has a combination of numeric and categorical data,
and the dependent variable for this analysis will be “Price” which is a
numeric variable.
We would like to achieve the following:
1. Run correlations on the different features of an Airbnb listing and determine
how they affect the price.
2.Conduct Exploratory Analysis to determine the most popular features in an
Airbnb listing.
3. Run Regressions and Random Forest predictive models to predict the most
optimal base price brackets for and Airbnb host.
Exploratory Data Analysis
Amenities Highly Correlated with Price
Based correlation analysis between the different amenities and price, we find
that the amenities “dining area”, “pool or tub”, and “bar” have highest
correlation with price. The analysis shows that the median price of listings
that have a regular or formal dining area is higher by a significant amount of
around $500. Places that offer Swimming pools, spas or saunas also have a
higher median price than those that don’t.
Amenities with Low Correlation with Price
Low correlated Amenities There are also amenities, like the bidet, which seem
to drive up the price of houses, however, the correlation analysis shows
insignificant correlation between this amenity, and the price. The reason for
this difference in price could again be due how upscale the rest of the
accommodation is.
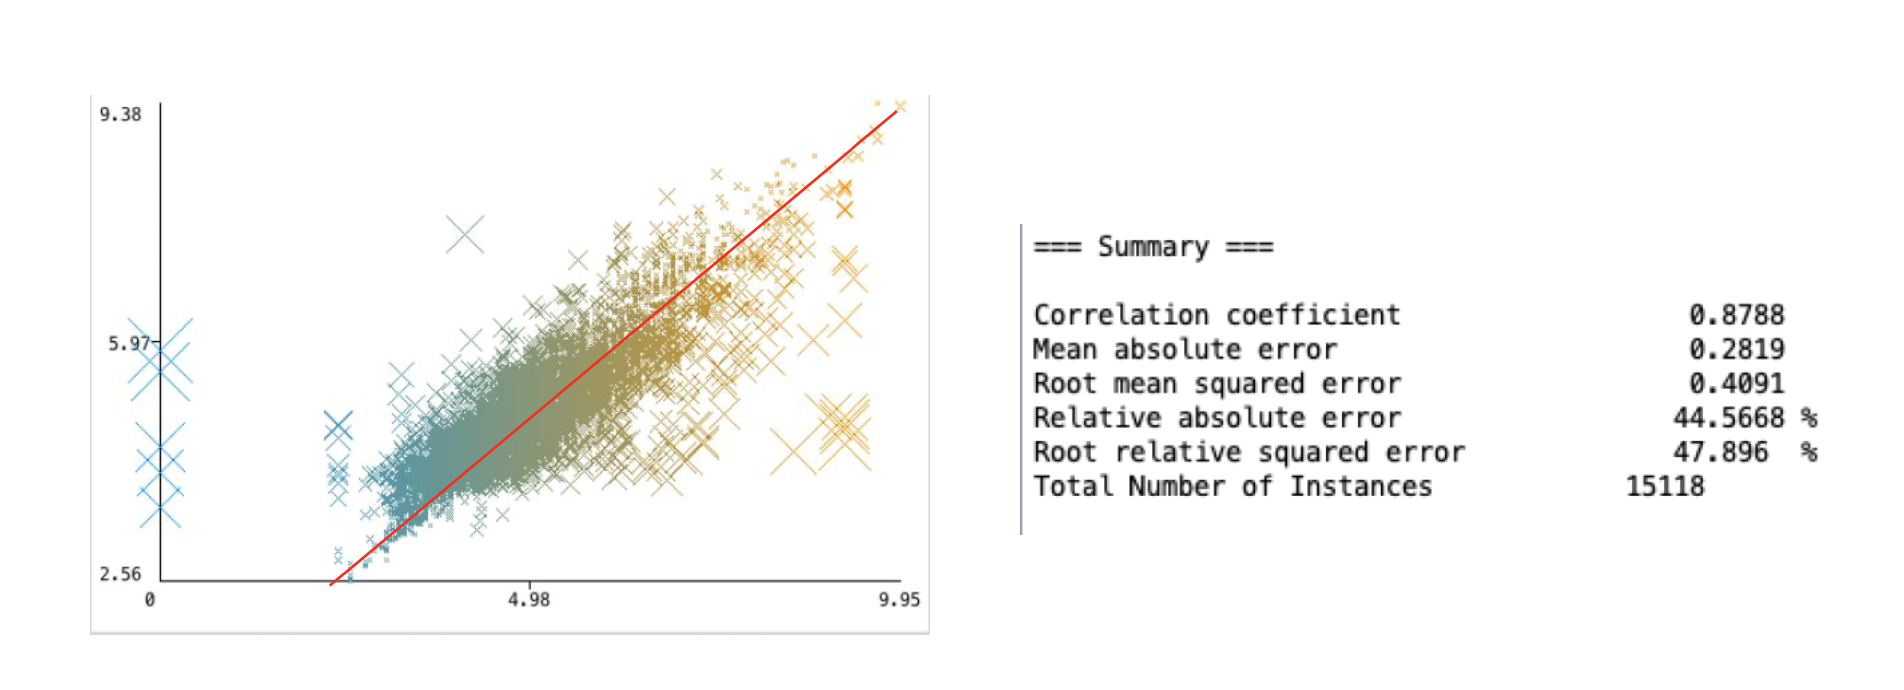
Prediction with Random Forest
The categorical variables used for this predictions were property_type and
room_type. The model was generated using 80% of the data for training and the
remaining as test data. The number of iterations is set to 100. The results
are as shown below.
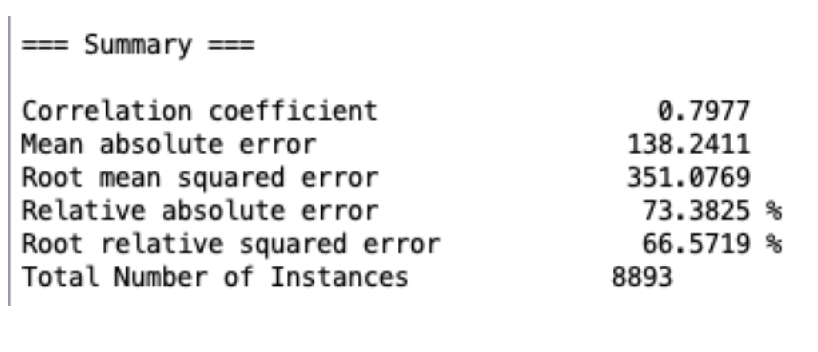
The graph was difficult to interpret due to the price variable being extremely
right skewed. In order to improve readability, the price was transformed using
log-transform so that it was not right-skewed. We created dummy variables for
several of the categorical columns and came up with this distribution:
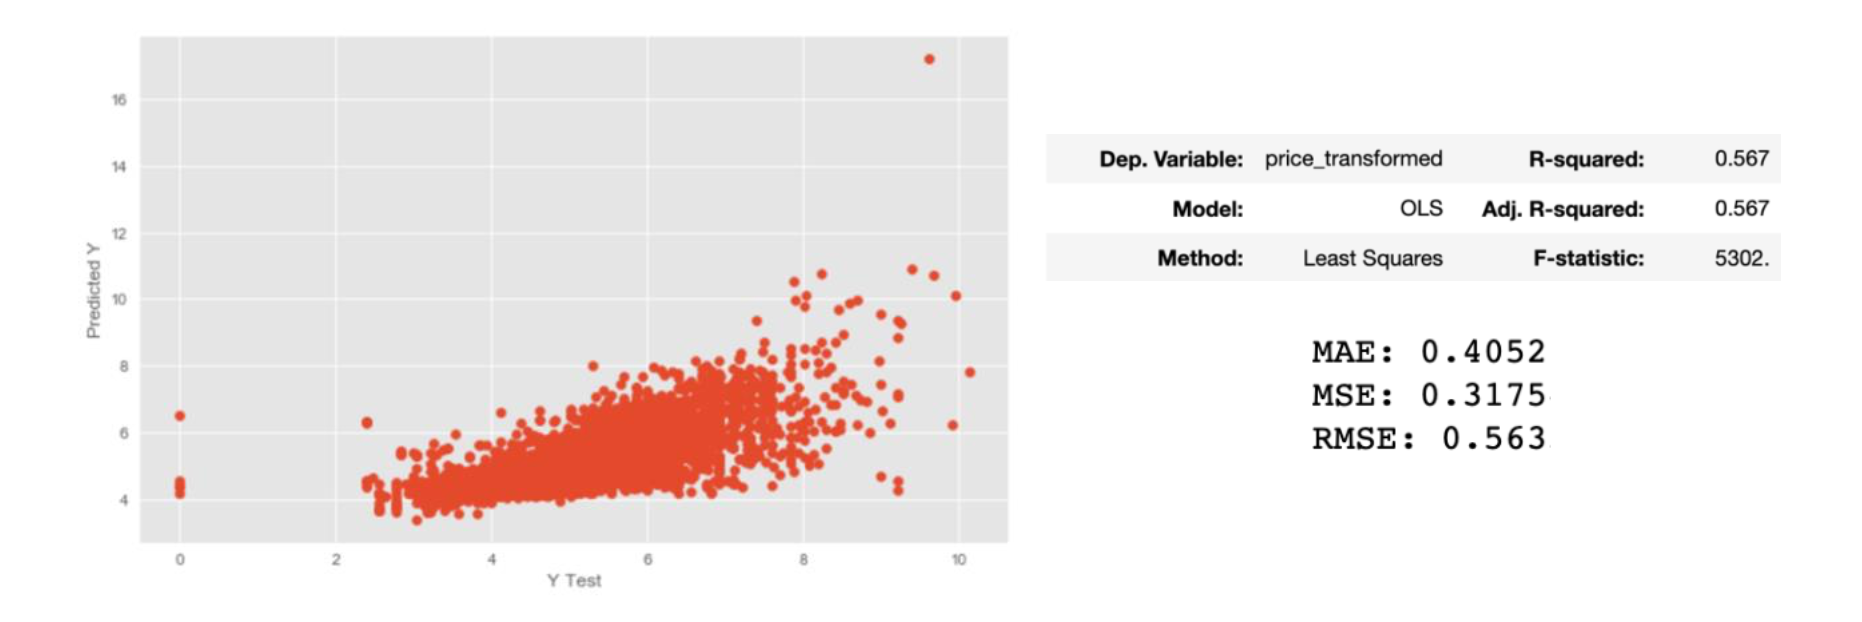
Prediction with Linear Regression
Linear regression was run with Price as the target variable, and the other
variables as predictors. The following results were generated