Link to Comscore Website
A Comscore dataset was given to the project team by the UC Irvine Business School. Given the data, the goal of this project was to understand which factors impacted customers purchasing behavior, and how we can increase a customers basket total based on recommending them with items they might be more likely to purchase. Although Comscore provided us with user data from over 20 different domains (countries), our interest was in the type of products customers purchased rather than which domain customers purchased on, so domain information was filtered out.
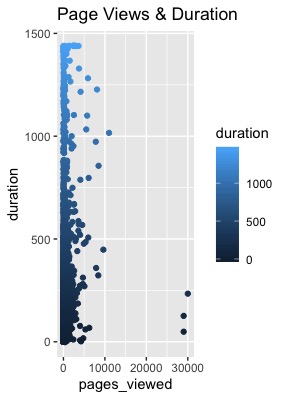
As we can see here, there is no relationship between pages_viewed and duration. For the same number of pages_viewed, the duration can be either very small or very large. One possible confounding factor here is that people may leave their computers on but not be actively viewing a page but the duration variable is still tracked.
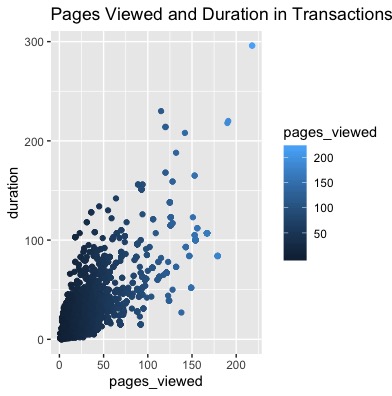
We want to further investigate the relationship between pages_viewed and duration. We join the sessions table with the transactions table in order to see what the relationships is for people who made purchases. In the above graph, we see that pages_viewed and duration have a linear relationship indicating that when people are making a purchase decision. This indicates that when making a purchase the time spent on a page and the time spent overall on the website linearly increases when you have a serious buyer.
Clustering is a powerful technique to explore patterns structures within data and has wide applications in business analytics. We decided to use clusters to break our large dataset into smaller groups of customer segmentation based on their attributes. Based on the cluster outputs companies can better target on customer segmentations.
We do data cleaning by removing irrelevant columns and making sure data is consistent. Then, we plot an SSE curve to see how many clusters we should form. We decide to make 4 and generate the following cluster plot:
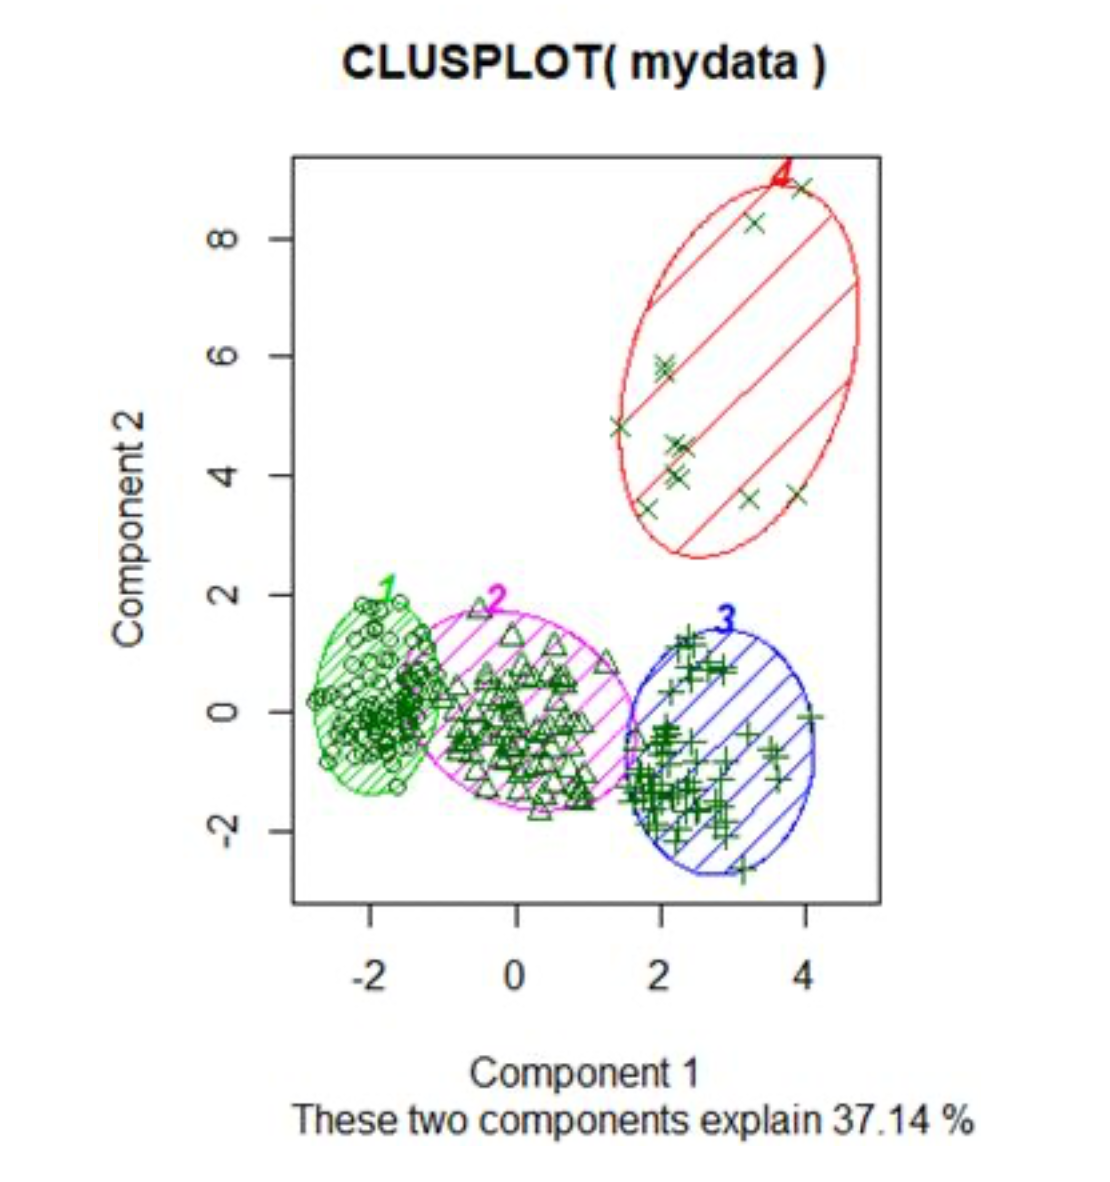
Our cluster output shows that there are 99 observations in cluster 1, 73 observations in cluster 2, 63 observations in cluster 3, and 12 observations in cluster 4. The computed clusters from the k-mean method shows that three out of the four clusters have roughly similar numbers of observations. Generally speaking the clusters have clear boundaries, there are some minor overlaps between cluster 1 and 2, and between cluster 2 and 3. Cluster 4 is the most unique group out of all four clusters.
We explored the customer segment persona from the clusters by comparing average duration of visiting sites and household education based on cluster distribution. Cluster 3 stands out in characterizing users with high school diplomas who do not spend a long time browsing websites in comparison to individuals who might be more educated. This means that less educated users educated might have a lower likelihood to convert and make a transaction on a website. Cluster 2 has a higher average duration compared with the other clusters.
The purpose is to suggest relevant items to users. To achieve this task, there are three major requirements that need to be satisfied to build a recommender system model, which are 1) users’ information, 2) the purchased items and 3) their interaction for each transaction. Collaborative filtering methods for recommender systems are methods that are based solely on these three variables. Specifically, it looks through past interactions recorded between users and items in order to produce new recommendations. Those interactions can be ratings, reviews and purchase frequency that can represent buyers’ preferences for each transaction.